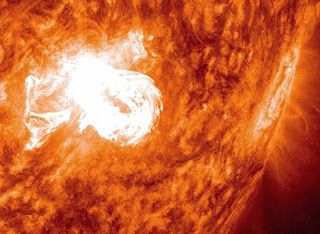
An M5 flare (medium-size) associated with a coronal mass ejection
generated a fairly robust radiation storm (May 22-23, 2013). The
outburst originated from active region right near the right edge of the
Sun. After the eruption, cascades of magnetic loops spun up above the
area as the magnetic fields tried to reorganize themselves. When viewed
in profile, they put on a marvelous display of solar activity. The
images are a combination of two wavelengths of extreme ultraviolet light
(at 171 and 304 Angstroms). Credit: NASA's Solar Dynamics Observatory.
Showing posts with label Nasa images 2014. Show all posts
Showing posts with label Nasa images 2014. Show all posts
Swirls along an Ice Highway - Nasa Images
Sea water off the east coast of Greenland looked a bit like marbled paper in October 2012. The shifting swirls of white were sea ice, as observed by the Moderate Resolution Imaging Spectroradiometer (MODIS) on NASA’s Aqua satellite on October 17, 2012. In fact, this ice moved discernibly between October 16 and October 17. Thin, free-drifting ice moves very easily with winds and currents.
Each year, Arctic sea ice grows through the winter, reaching its
maximum extent around March. It then melts through the summer, reaching
its minimum in September. By October, Arctic waters start freezing
again. However, the ice in the image above is more likely a remnant of
old ice that migrated down to the coast of Greenland. Sea water is
unlikely to start freezing this far south in October.
Along Greenland’s east coast, the Fram Strait serves as an expressway for sea ice moving out of the Arctic Ocean. The movement of ice through the strait used to be offset by the growth of ice in the Beaufort Gyre.
Until the late 1990s, ice would persist in the gyre for years, growing
thicker and more resistant to melt. Since the start of the twenty-first
century, however, ice has been less likely to survive its trip through
the southern part of the Beaufort Gyre. As a result, less Arctic sea ice
has been able to pile up and form multi-year ice.
With less thick ice there is less Arctic sea ice volume, something
the researchers at the Polar Science Center at the University of
Washington have modeled from 1979 to 2012.
Their results appear in the graph above. The model indicates that ice
volume peaks in March through May of each year and reaches its lowest
levels from August through October. But while the seasonal timing of the
peaks and valleys has remained consistent since 1979, the total sea ice
volume has declined.
The thick blue line is the 1979–2000 average, and the lighter blue bands surrounding it are one and two standard deviations
from the median. The lines below the blue line are the calculated sea
ice volumes for the years since 2000. All of them fall below the median,
and almost all of them fall below two standard deviations.
The drop in sea ice volume is consistent with other observed changes
in Arctic sea ice. In terms of sea ice extent, the National Snow and Ice
Data Center and NASA reported that Arctic sea ice set a record low in September 2012.
NASA Released January Solar Flare Images
The sun emitted a mid-level solar flare, peaking at 5:13 a.m. EST on
Jan. 7, 2014. Images of the flare were captured by NASA's Solar Dynamics
Observatory and showed that it came from an active region on the sun
that currently sports one of the largest sunspots seen in the last 10
years. Sunspots are regions of strong and complex magnetic fields on the
sun's surface.
Solar flares are powerful bursts of radiation. Harmful radiation from
a flare cannot pass through Earth's atmosphere to physically affect
humans on the ground, however -- when intense enough -- they can disturb
the atmosphere in the layer where GPS and communications signals
travel.
To see how this event may impact Earth, please visit NOAA's Space Weather Prediction Center at http://spaceweather.gov, the U.S. government's official source for space weather forecasts, alerts, watches and warnings.
This flare is classified as an M7.2-class flare.
Two Solar Flares Welcomes 2014 - Nasa Space News
Unknown
Latest Nasa news, Nasa 2014, Nasa images 2014, NASA Space News
The sun ushered out 2013 and welcomed 2014 with two mid-level flares on
Dec. 31, 2013 and Jan. 1, 2014. Solar flares are powerful bursts of
radiation. Harmful radiation from a flare cannot pass through Earth's
atmosphere to physically affect humans on the ground, however -- when
intense enough -- they can disturb the atmosphere in the layer where GPS
and communications signals travel. This disrupts the radio signals for
as long as the flare is ongoing, anywhere from minutes to hours.
To see how this event may impact Earth, please visit NOAA's Space Weather Prediction Center at http://spaceweather.gov, the U.S. government's official source for space weather forecasts, alerts, watches and warnings.
The first flare (below) was categorized as an M6.4 and it peaked at
4:58 p.m EST on Dec. 31. The second (above) was categorized as an M9.9
and peaked at 1:52 p.m. EST on Jan. 1. Both flares emerged from the same
active region on the sun, AR1936. Imagery of the flares was captured by NASA's Solar Dynamics
Observatory, which keeps a constant watch on the sun, collecting new
data every 12 seconds.
Subscribe to:
Posts (Atom)


